Hi !
To complete what I sent you by email, I put my little issue here with a little more documentation.
I am looking for a tool like PlantUml, would make diagrams from text interpreted. Schemes are therefore modeled Merise, a French tool conceptual data modeling.
Here is a small example:
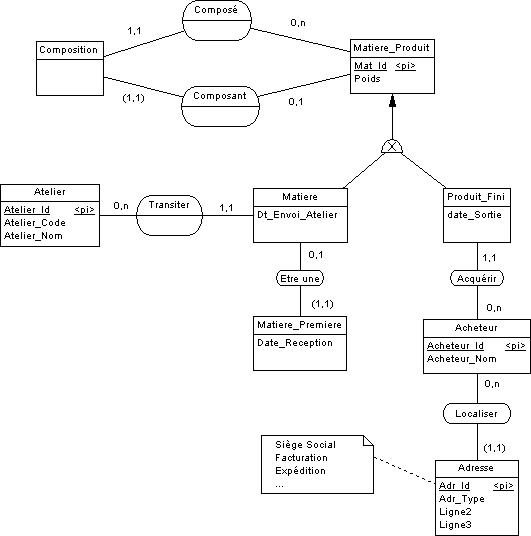
The rectagle are entities, oval associations between these entities. The numbers on the links are cardinalities. Entities are always connected to each other with an association.
In entities, such as associations, can have properties. Properties that are highlighted in the entities are those used to identify them.
Different cardinalities are:
-
0,1 : zero or one
-
1,1 : one and only one
-
0,n : zero or more
-
1,n : one or more
-
(1,1) : one and only one, with an identification related
For example, to read this diagram, we can say:
-
Acheteur 0,n => Acquérir <= 1,1 Produits fini :
-
Un Acheteur peut acquérir zéro ou plusieurs Produits finis.
-
A Buyer may acquire zero or more Finished products.
-
Un Produit fini est forcément acquis par un Acheteur.
-
A Finished product is necessarily acquired by a Buyer.
The strange object with an X in the middle indicates an inheritance, with exclusion:
-
Un Matiere_Produit sera SOIT une Matière, SOIT un Produit fini.
-
A Matiere_Produit be a Material BE EITHER a Finished product.
You can have a look at this website for an example of dynamically generated graphics MERISE :
http://mocodo.wingi.net/
Unfortunately, I did not find any documentation in English explaining the MERISE modeling worthy of the name :/
As I find PlantUml handy, I wondered whether it would be possible to add the ability to model in MERISE.