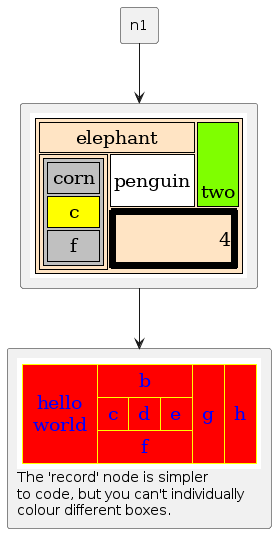
I'm not sure whether your example picture renders properly for me, it looks more like a table of some sort.
But going with your "My goal is to create a new kind of shape, that I can fill with text and different background colors, that I could use in my diagrams.", I thought I'd mention this option of PlantUML that lets you create complex shapes by embedding a raw graphviz html node in the PlantUML node. (I took the example from https://graphviz.org/doc/info/shapes.html)
@startuml
skinparam ComponentStyle rectangle
rectangle n2 [
{{
digraph foo {
    b [shape=none, margin=0
  label=<
<TABLE BGCOLOR="bisque">
  <TR><TD COLSPAN="3">elephant</TD>
      <TD ROWSPAN="2" BGCOLOR="chartreuse"
          VALIGN="bottom" ALIGN="right">two</TD> </TR>
  <TR><TD COLSPAN="2" ROWSPAN="2">
        <TABLE BGCOLOR="grey">
          <TR> <TD>corn</TD> </TR>
          <TR> <TD BGCOLOR="yellow">c</TD> </TR>
          <TR> <TD>f</TD> </TR>
        </TABLE> </TD>
      <TD BGCOLOR="white">penguin</TD>
  </TR>
  <TR> <TD COLSPAN="2" BORDER="4" ALIGN="right" PORT="there">4</TD> </TR>
</TABLE>>
  ]
}
}}
]
rectangle n3 [
{{
digraph foo {
struct3 [shape=record style=filled, color=yellow, fontcolor=blue, fillcolor=red, label="hello\nworld |{ b |{c|<here> d|e}| f}| g | h"];
}
}}
The 'record' node is simpler
to code, but you can't individually
colour different boxes.
]
[n1] --> n2
n2 --> n3
@enduml
Unfortunately I don't think you can get away from the 'box within a box' look.