How to explain used line types/associations in a diagram

0 votes
asked Mar 8, 2019 in Question / help by anoff (160 points)
I am wondering what the best way is to explain what specific associations (--, .., ..|>) mean. Not everyone is fluent in UML and for certain diagrams I want to explicitly state that a certain line type is to be interpreted as dependency, data flow, etc.

Simply putting the association in a legend does not work http://www.plantuml.com/plantuml/uml/BOvH3i8m34F_UmfVOBi1Q1zmaBGDg5ANeYw8dnoUJCjFR4VoaxT3QUftxqb6PT0b-PAI2CjozvYnhXuxlrbgWjtmxBopw6aVV9JPFjg6m18CqJ9KKiAhZr_yJqfsqqHvKec68mEy-V4jVm00

Does anyone have a best practice how to achieve this?

2 Answers

+1 vote
answered Mar 8, 2019 by Serge Wenger Work (15,620 points)
selected Mar 8, 2019 by anoff
 
Best answer

You can try:

@startuml
node a
node b
node c
a --> b: data flow
b .. c:interaction 
@enduml

http://www.plantuml.com/plantuml/png/SoWkIImgAStDuShBJqbLI8HGIH0gcIjHGLVNJY79IY4biIHH8IqdlvmhIK5FJo7PAZEl9BKeCRaaCpzFWSiXDIy5Q0O0

commented Mar 8, 2019 by anoff (160 points)
Works for a small example, but if I have 20 of those elements I would prefer a "legend" style where I only explain this relationship once.

Do you know if there is a way to force puml to render --/.. lines in a legend?
commented Mar 8, 2019 by Serge Wenger Work (15,620 points)
You can create an image and after use it on all your diagrams:

@startuml
node a
node b
node c
a --> b
b .. c
legend
Use image : <img:http://plantuml.com/logo3.png >
end legend
@enduml
0 votes
answered Mar 8, 2019 by zimchaa (1,040 points)

Per the other answer and your comment - I don't think there's a way to render the line styles within a specific 'Legend' area, and the C4-PlantUML approach, examples here: https://github.com/RicardoNiepel/C4-PlantUML shows how colour can be used instead to good effect.

However, I've used a separate part of the diagram within an unspecific 'Legend' folder to allow a faithful redrawing of the elements that I want to reuse in the diagram, including elements of the diagram alongside the linestyles.

component Data Processing System

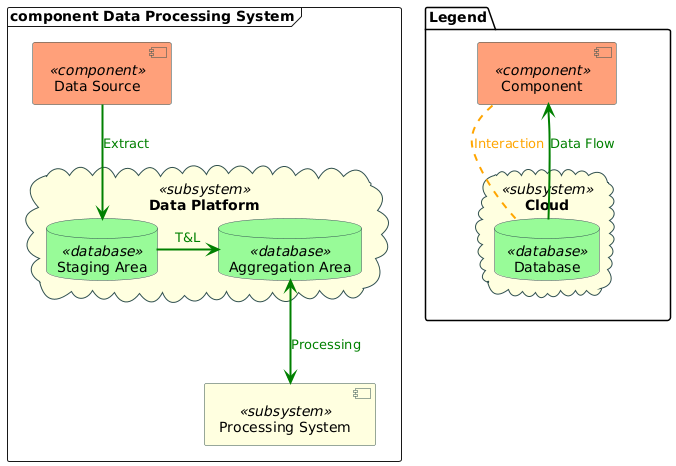
(Click through to see the code)

I use the stereotype and the skinparams to help reduce the complexity of the actual drawing, the main part of the above could be standardised and included as a link (per the C4-PlantUML approach again) to simplify it even further; it allows for simple changes to the colour and style - there's a small possible bug that I'm going to raise where the linestyle, e.g. dashed or solid doesn't seem to be able to be changed after the usage of the '--' or '..' used to create it in the diagram, but it's a small thing.

commented Mar 8, 2019 by anoff (160 points)
Thanks for your examples. I actually dislike the color approach; especially with slight color variations. Several people I worked with over the last years had color blindness to some degree, so relying more on the "UML style" of displaying different meanings by different arrowhead/line styles is my preferred solution.

Plus, we have probably all seen crappy projectors/printers that mess up colors :)
commented Mar 8, 2019 by zimchaa (1,040 points)
Yes, and with printing - it should be able to be printed in b&w without any loss of information - I include colour in the diagrams just to aid with the speed of interpretation - plus I’m a bit red-green colourblind, so that can be annoying (the pastel-ish shades I chose work fine for me)
...